Everyone’s
using AI.
Almost nobody
pays for it.
The headline number is not another model launch. It’s the 4.5% of U.S. consumers with an active paid personal subscription to ChatGPT, Gemini, or Claude. Reach is racing ahead. Habit—and revenue—are not.
7TH EDITION
personal AI subscription
report using AI
with AI daily
Gemini, or Claude
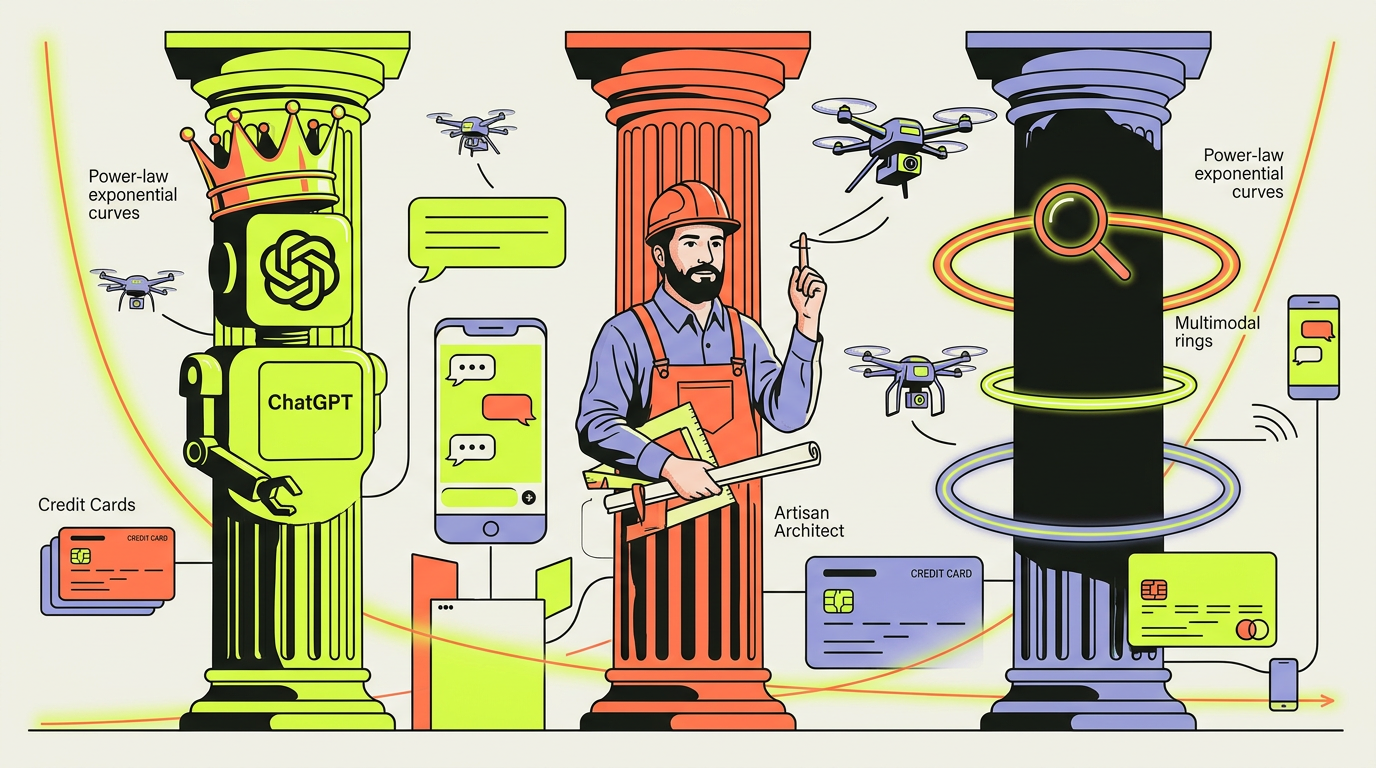
Use is wide.
Habit is thin.
Three years into the consumer AI wave, familiarity is not the same thing as daily reliance. Tap a signal to see what the narrowing funnel really says.
A tiny cohort
moves the money.
The paying base is growing, but observed consumer AI spend is startlingly top-heavy. Change the lens: compare share of spend, or actual monthly outlay.
BAR LENGTH SCALED TO THE $903 TOP-1% AVERAGE.
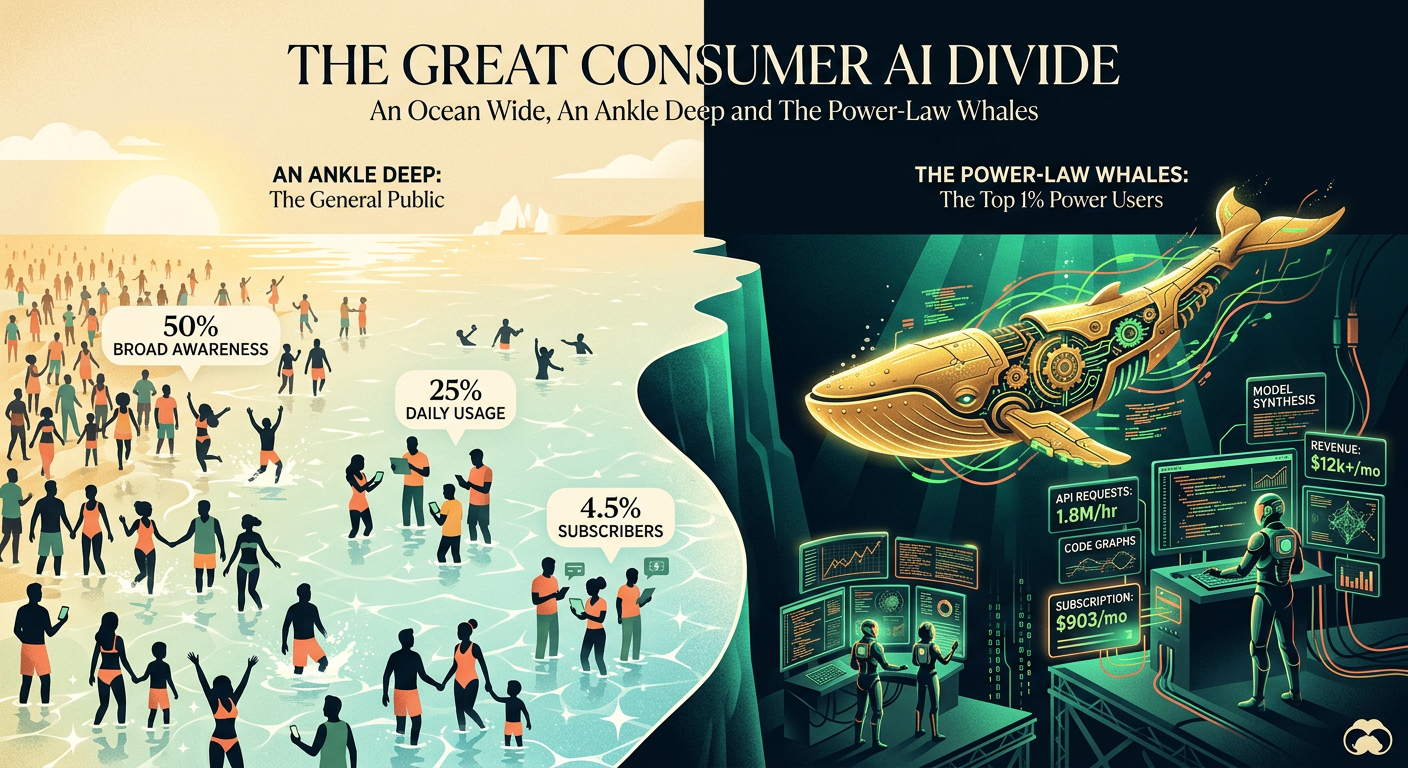
YIPITDATA U.S. PANELS · FIGURES ARE PANEL-BASED AND SHOULD NOT BE READ AS CENSUS OR TOTAL COMPANY REVENUE. THE TOP-1% / MEDIAN COMPARISON IS ACROSS DIFFERENT SPENDER COHORTS.
The leader changes
with the lens.
ChatGPT remains the scale leader. Claude’s rise, Gemini’s reach, and the differences between web, mobile, and payment tell a more interesting story than one leaderboard.
Claude’s most expensive plan has an outsized share of its payers.
SHARE OF EACH PRODUCT’S CONSUMER PAYERS ON ITS CORRESPONDING ~$100/MO INDIVIDUAL PLAN. CLAUDE MAX STARTS AT $100/MO. YIPITDATA PANEL.
A hit app can be
a quiet business.
The first spend ranking surfaces products that traffic charts miss—and shows how differently some vendors monetize their most committed users.
products rank in the top group across web, mobile, and revenue.
first-time appearances—the fewest debuts across all seven editions.
THE SEVEN OVERLAPPING PRODUCTS ARE CHATGPT, CLAUDE, SUNO, PERPLEXITY, PHOTOROOM, CANVA, AND NOTION.
The next interface
may know how to buy.
Personal agents are moving from developer demos toward textable assistants. Their early adoption is still a power-user story—but the transaction signal is hard to ignore.
MUSE REPORTEDLY REACHED 250K DAILY ACTIVES IN ITS FIRST WEEK. ITS 5M+ DOWNLOAD MILESTONE ARRIVED IN LESS THAN A MONTH.
THE $1,300 IS AVERAGE MONTHLY SPEND THROUGH INSTINCT AMONG USERS WHO MAKE A PURCHASE—not a subscription fee.
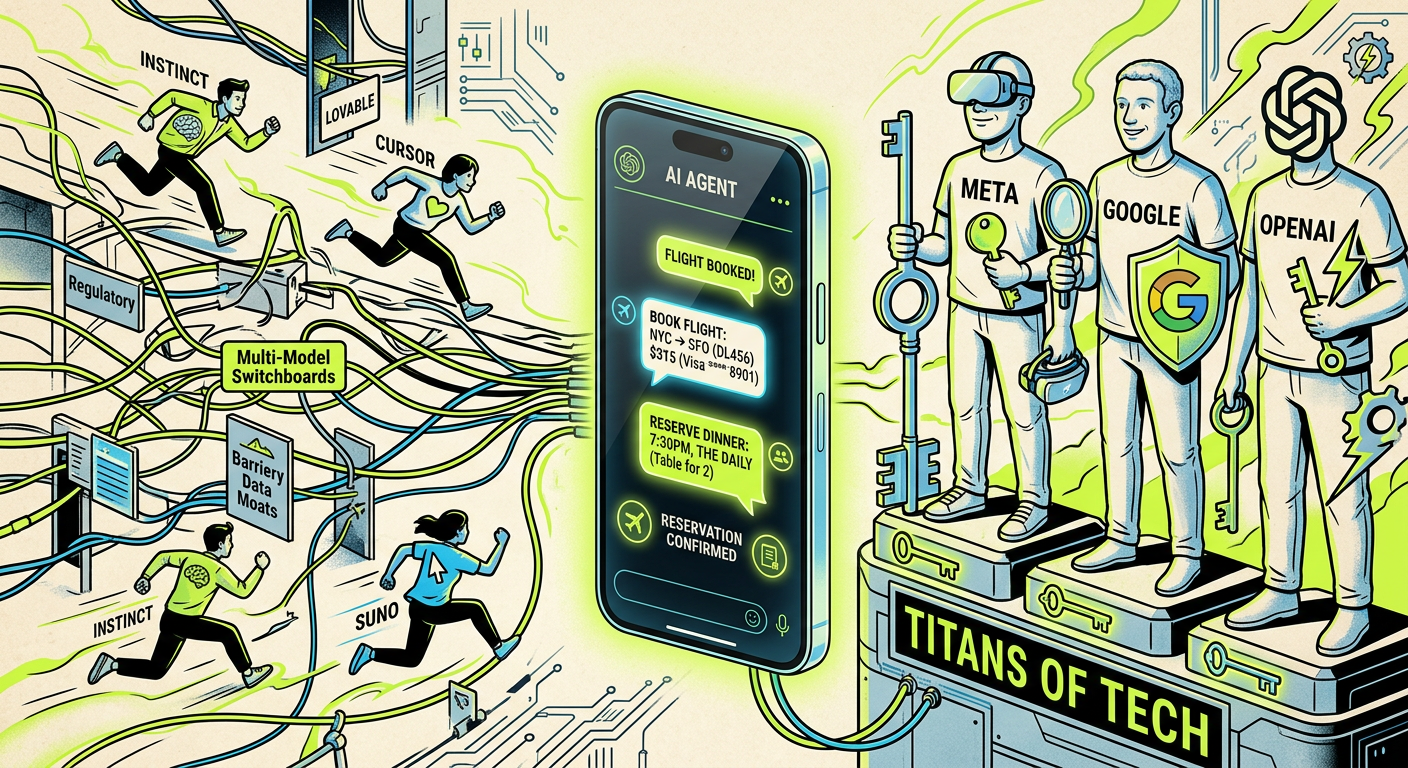
AGENT ADOPTION AND TRANSACTION FIGURES ARE REPORTED IN THE ARTICLE, INCLUDING FOUNDER CLAIMS. EARLY-USER GROUPS ARE NOT REPRESENTATIVE OF THE GENERAL POPULATION. MUSE / THREADS TIME WINDOWS DIFFER.
AI sells seats.
The internet sold attention.
High model costs pushed consumer AI toward subscriptions and credits. But those are not the only ways to make useful software pay. Select a model to inspect the current mix.
PRODUCTS CAN USE MORE THAN ONE MODEL; PERCENTAGES ARE NOT PARTS OF A 100% STACK.
A DIFFERENT DENOMINATOR, A DIFFERENT ERA: THESE AD-REVENUE SHARES ARE COMPANY REVENUE; THE 14% ABOVE IS THE SHARE OF A PRODUCT SAMPLE THAT OFFERS ADS. AMAZON SUBSCRIPTION SERVICES WERE 6.9% OF ITS 2025 REVENUE, PER THE REPORT.
The next leap
is not more AI.
It’s more everyday.
The opportunity is to make AI useful beyond the power user: agents that act, creative tools with a distinct edge, and business models that let people start free and pay when value shows up.
Subscriptions will stay. Ads and transactions could make the magic accessible to more than the 4.5% already paying for a leading assistant.
Read the full report ↗Source: Olivia Moore, “The Top 100 Gen AI Consumer Apps — 7th Edition,” a16z, October 5, 2026. This independent visualization is based on the figures and descriptions in that report and is not affiliated with or endorsed by a16z. Traffic rankings draw on Similarweb and Sensor Tower; consumer spend figures are from YipitData U.S. panels. All figures are reported estimates or panel observations, not a census, and some are founder-reported claims. Metrics use different populations, windows, and definitions; comparisons are directional unless explicitly stated. Company and product names are trademarks of their respective owners. This site is informational and not investment advice.